Face Form Finder
Ear Shapes: The Numbers Behind the Four Names
Ear shape pages give you names and a picture of each one. They give you no count and no distance. This page gives both: how often each of the four shapes turns up across 400 people, read separately for each side and each age band, the five more features tallied on the same ears, and the millimetres that move when the group changes.
| Group | Oval | Rectangular | Round | Triangular |
|---|---|---|---|---|
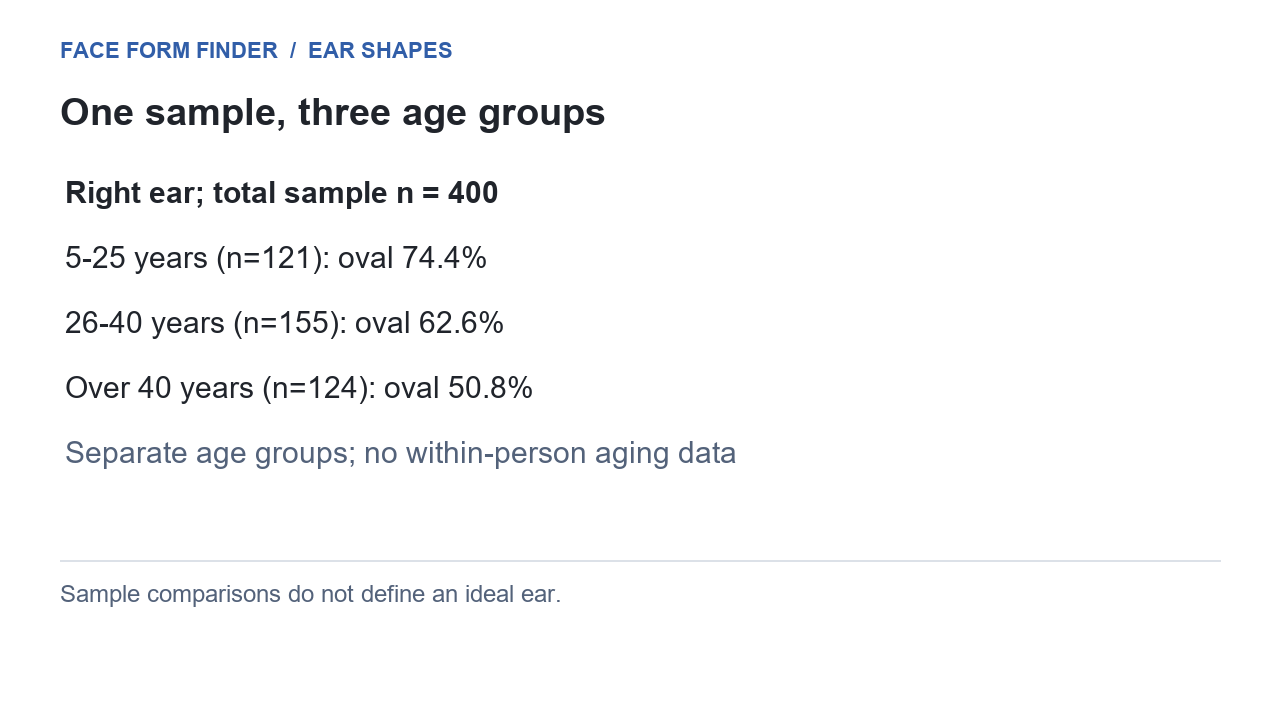
| Right ear, 5–25 yr (n = 121) | 90 (74.4%) | 14 (11.6%) | 8 (6.6%) | 9 (7.4%) |
| Right ear, 26–40 yr (n = 155) | 97 (62.6%) | 18 (11.6%) | 15 (9.7%) | 25 (16.1%) |
| Right ear, over 40 yr (n = 124) | 63 (50.8%) | 26 (21.0%) | 13 (10.5%) | 22 (17.7%) |
| Right ear, men (n = 222) | 137 (61.7%) | 37 (16.7%) | 17 (7.7%) | 31 (14.0%) |
| Right ear, women (n = 178) | 113 (63.5%) | 21 (11.8%) | 19 (10.7%) | 25 (14.0%) |
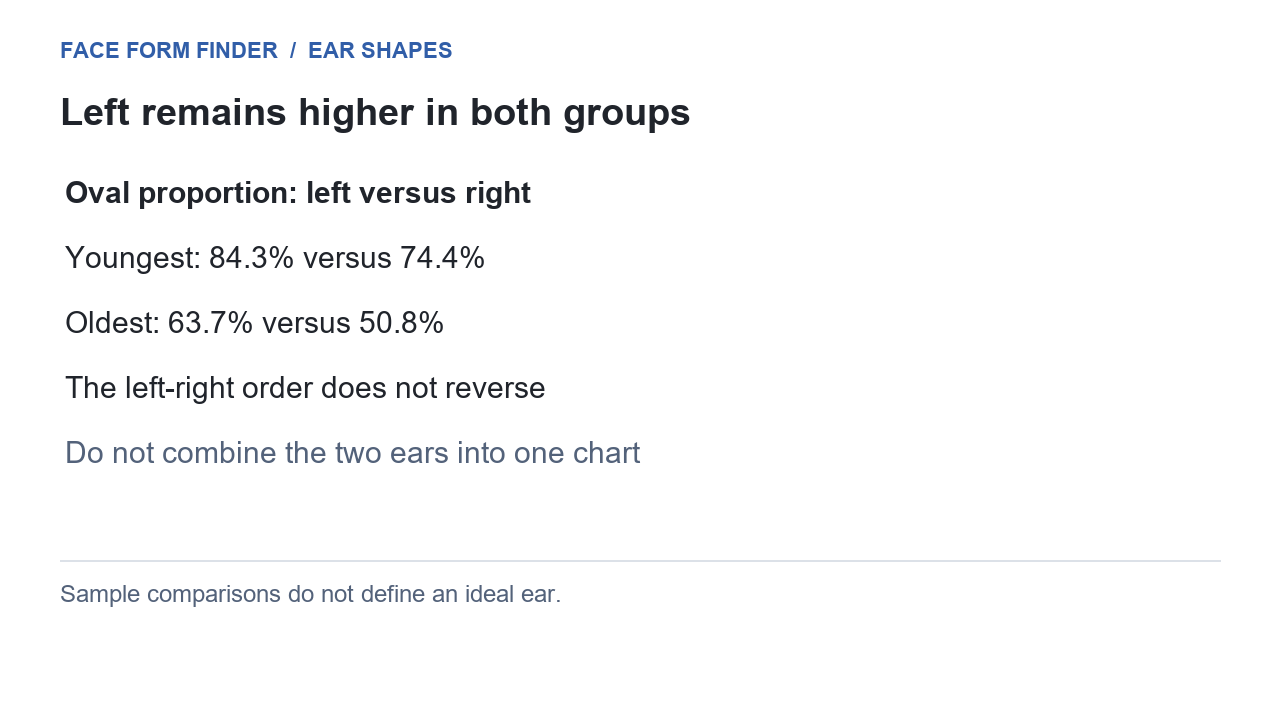
| Left ear, 5–25 yr (n = 121) | 102 (84.3%) | 10 (8.3%) | 2 (1.7%) | 7 (5.8%) |
| Left ear, 26–40 yr (n = 155) | 111 (71.6%) | 11 (7.1%) | 7 (4.5%) | 26 (16.8%) |
| Left ear, over 40 yr (n = 124) | 79 (63.7%) | 21 (16.9%) | 11 (8.9%) | 13 (10.5%) |
| Left ear, men (n = 222) | 158 (71.2%) | 25 (11.3%) | 11 (5.0%) | 28 (12.6%) |
| Left ear, women (n = 178) | 134 (75.3%) | 17 (9.6%) | 9 (5.1%) | 18 (10.1%) |
The counts are of 400 right ears and 400 left ears. The age rows and the sex rows describe the same 400 people read two ways, so the rows do not add up to a larger sample than 400.
What the counts say about the four names
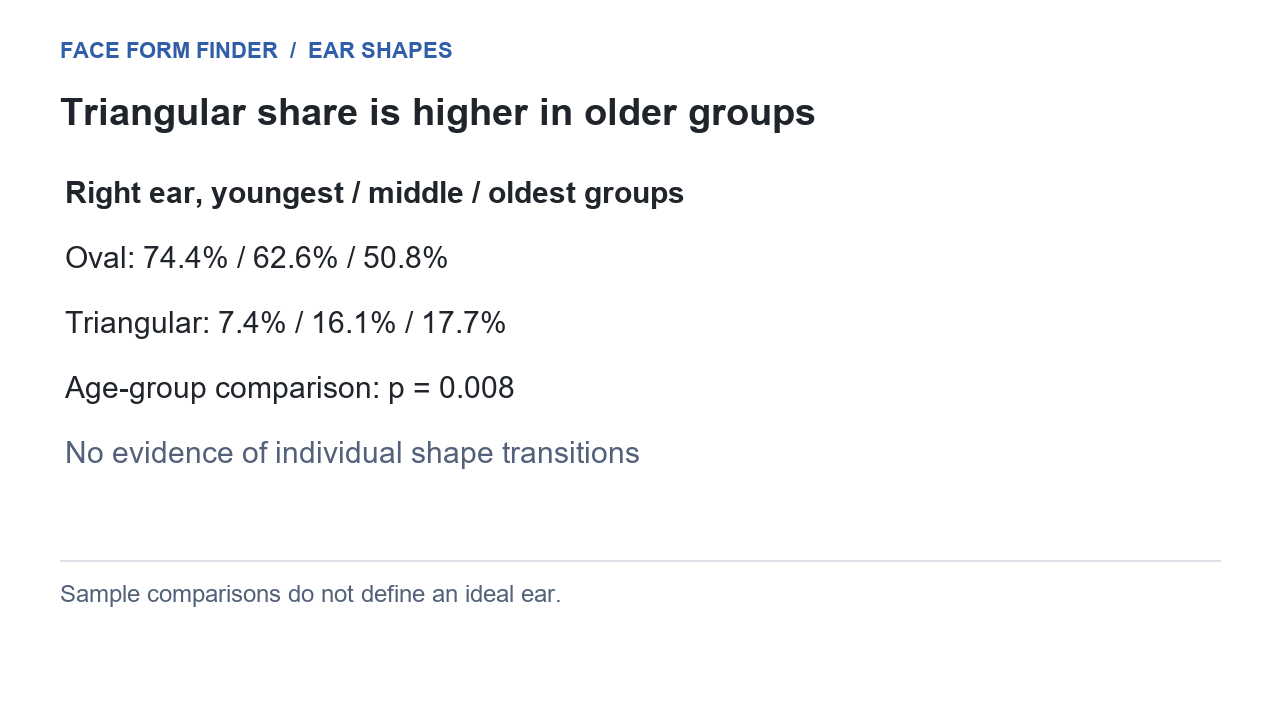
Oval leads in each of the ten rows. The lead is not fixed. On the right ear it falls from 74.4 percent in the youngest band to 62.6 percent in the middle band and 50.8 percent in the oldest.
On the left ear the same column falls from 84.3 to 71.6 to 63.7. Age separates the four names in this group: p = 0.008 on the right ear and p < 0.001 on the left. Sex does not. Read the same ears by sex instead of by age and the four shares barely move: p = 0.446 on the right and p = 0.791 on the left.
What absorbs the fall differs by side. On the right the triangular column climbs from 7.4 percent to 16.1 percent to 17.7 percent, while the oval column falls. On the left the triangular column goes 5.8 to 16.8 and then back down to 10.5, while the rectangular column jumps from 7.1 percent in the middle band to 16.9 percent in the oldest. The words that replace oval are not the same words on the two sides.
The two sides are not the same chart either. In the youngest band the left ear is 84.3 percent oval against 74.4 percent on the right, a gap of 9.9 points. By the oldest band the left ear is still ahead: 63.7 percent on the left against 50.8 percent on the right. Nothing says the two ears of one person carry the same name, and these counts are a reason not to assume it.
A second group of 200 adults aged 18 to 30, measured with callipers rather than a three-dimensional scan, puts the same four names in a different order. Its right ears read 63.5 percent oval, 32.5 percent rectangular, 4.0 percent triangular and 0.0 percent round. Its left ears read 69.5, 24.5, 5.5 and 0.5.
Rectangular is nearly a third of the right ears in that group. No line in the 400-person table comes close: the highest rectangular share anywhere in its right-ear rows is 21.0 percent, in the oldest band. Round goes the other way, from between 6.6 and 10.7 percent in each right-ear row of the larger group to zero in the smaller one.
The two groups are not a controlled comparison. They differ in age range, in where in the country they were measured, and in the instrument — one a three-dimensional scan, the other a calliper. Which of the three caused the gap cannot be read off either table. What both tables do show is that a percentage attached to a shape name belongs to the group it was counted in.
The millimetres behind those names
Names come from one table and distances from another, because no group reports both for the same ear.
| What is measured | Northern India, 5–25 yr (n = 121) | Northern India, 26–40 yr (n = 155) | Northern India, over 40 yr (n = 124) | Central India, 18–30 yr (n = 200) | Zimbabwe, children (n = 305) |
|---|---|---|---|---|---|
| Ear length | 57.65 ± 5.55 mm | 59.28 ± 4.92 mm | 63.10 ± 6.60 mm | 63.58 ± 3.96 mm men 59.59 ± 3.45 mm women | 56.95 ± 5.00 mm |
| Ear width | 28.49 ± 3.15 mm | 29.93 ± 2.72 mm | 31.04 ± 3.95 mm | 35.00 ± 2.19 mm men 32.48 ± 2.31 mm women | — |
| Attachment length | 44.97 ± 5.23 mm | 46.70 ± 5.70 mm | 51.00 ± 5.78 mm | — | — |
| Ear angulation | 15.54 ± 2.88 degrees | 15.43 ± 2.38 degrees | 15.85 ± 2.93 degrees | — | — |
| Ear projection | — | — | — | — | 19.52 ± 2.14 mm |
Each figure in that table is a right ear. A dash means the group did not report that measurement, and the group reported its own numbers only for the side named above.
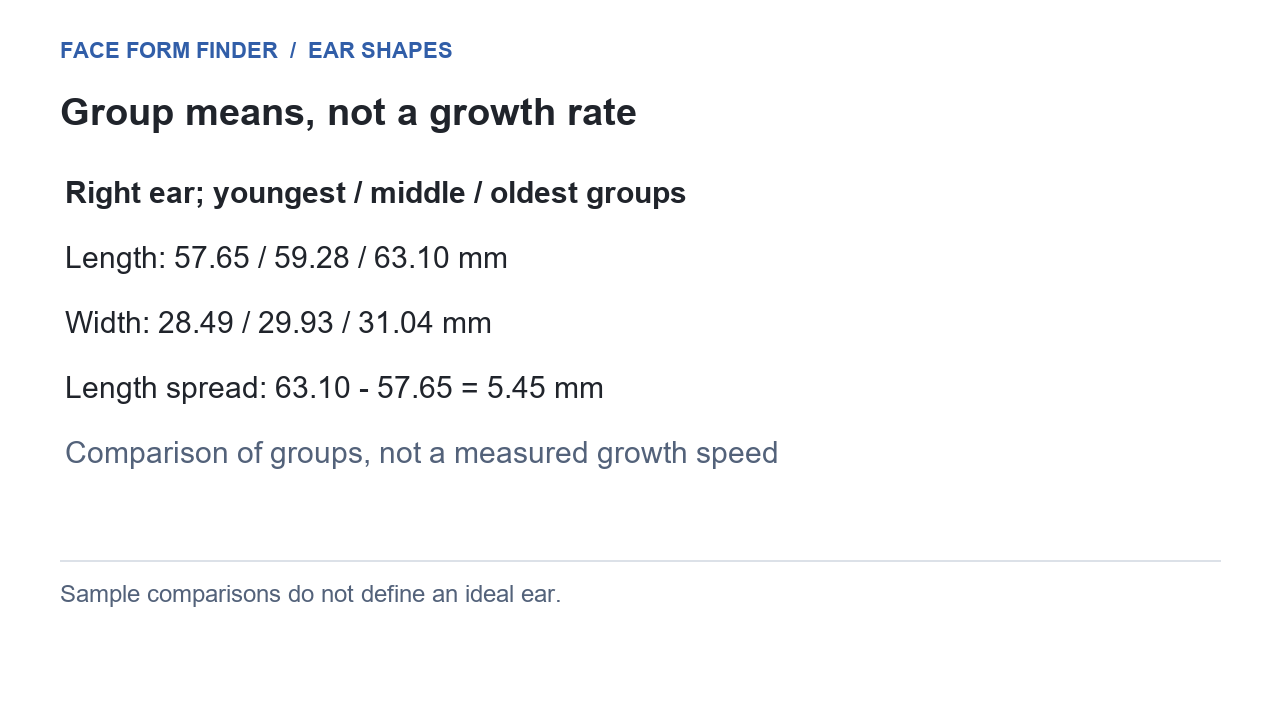
Length is the reading that moves most with age in the 400-person group: 57.65 mm in the youngest band, 59.28 mm in the middle, 63.10 mm in the oldest. That is a spread of 5.45 mm.
Sex moves it by about as much in the same group: 62.22 mm for the men against 57.18 mm for the women, a gap of 5.04 mm. A single average for the ear hides both of those.
Width moves less. Across the same three bands it goes 28.49 mm to 31.04 mm, a spread of 2.55 mm, and the sex gap is 1.06 mm. So the ear gets longer faster than it gets wider — which is how a shape name can change with age while the outline has not changed shape.
Attachment length, the run of the ear joined to the head, moves more with age than any other reading here: 44.97 mm to 51.00 mm across the three bands. Angulation, the angle the ear leaves the head at, barely moves, 15.54, 15.43 and 15.85 degrees, a spread of 0.42 degrees.
The other two groups fill in readings the 400-person set does not carry. Ear projection, how far the ear stands out from the side of the head, reads 19.52 mm in 305 primary-school children in Zimbabwe whose mean age was 11.5 years. Their ear length reads 56.95 mm, within 0.7 mm of the youngest band in the 400-person group.
The 200-adult group disagrees on size. Its right ears read 35.00 mm wide for the men and 32.48 mm for the women, against 30.31 mm and 29.25 mm in the 400-person group. Its length figures sit closer: 63.58 mm and 59.59 mm against 62.22 mm and 57.18 mm. So the two groups are within 2.5 mm of each other on length and 3.2 to 4.7 mm apart on width.
Why the two tables do not combine
Both tables are about ears. They are not two halves of one table.
The first counts names. The second measures distances. Nothing in either set links a name to a distance. No group here reports how long an oval ear is, or how wide a triangular one is, and no row of millimetres carries a shape label.
The two are taken differently as well. A shape name is assigned by looking at an ear and putting it in one of four boxes. The millimetres come from points marked on a three-dimensional image or held between the jaws of a calliper. A name and a distance are two different kinds of reading of the same ear.
So there is no column on this page that turns a shape name into a number, and no row that turns a number into a name. A page that hands you a length for a named ear shape is not repeating either table here, because neither table contains that link.
What the four names cover, and what they leave out
The four words describe the outline of the ear seen from the side of the head, the rim above and the lobe below read as one silhouette. They are not four sizes and not four positions on the head. A long ear and a short ear can both be oval.
The four words leave some ears out. A constricted ear, a Stahl ear, microtia and anotia are named from the fold and the rim instead, and none of the four counts above has a box for them.
A shape name is one count of an ear, and the same ears were tallied five more ways. Those counts sit below, and they are of the same ears as the outline counts, not of different people.
The same ears, counted five more ways
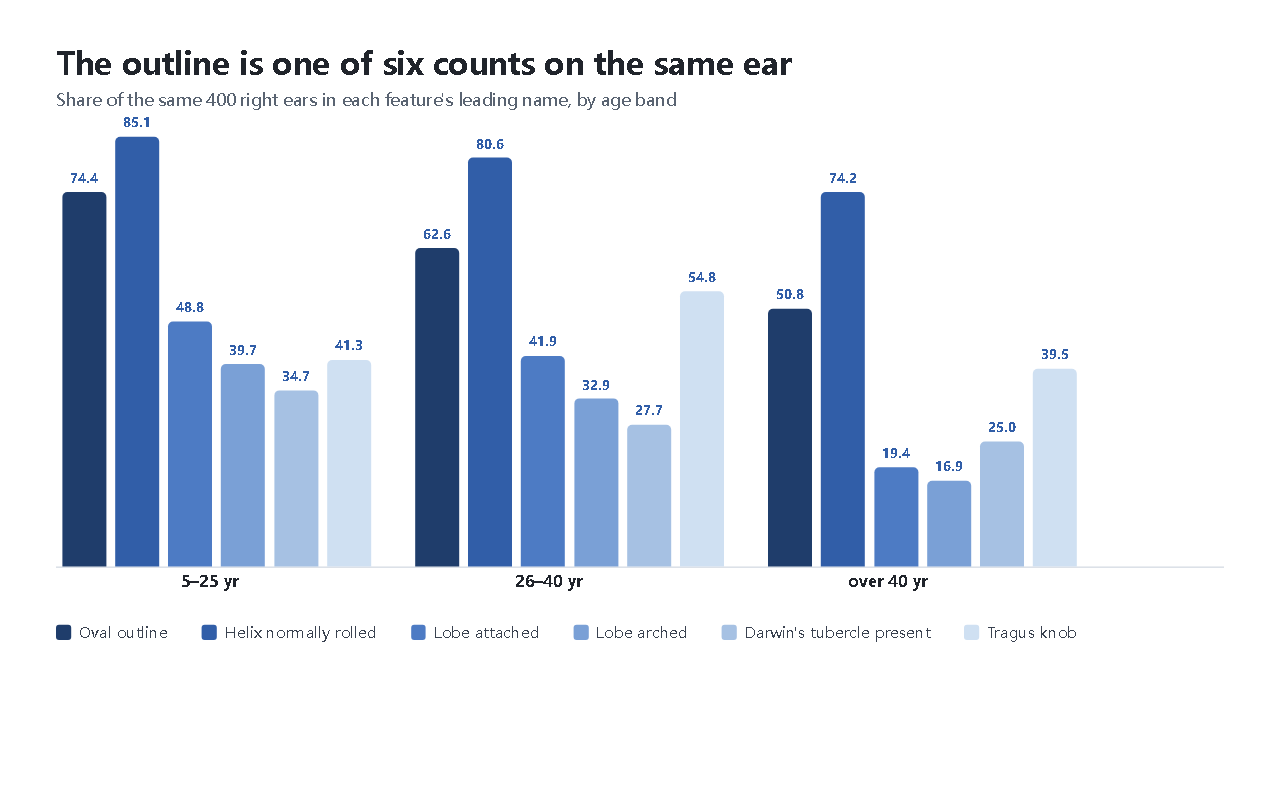
Five more features were counted on the same 400 right ears, in the same three age bands, and each feature carries its own set of names. The counts below are those right ears.
| Feature | Name | 5–25 yr | 26–40 yr | over 40 yr |
|---|---|---|---|---|
| Helix | Normally rolled | 103 (85.1%) | 125 (80.6%) | 92 (74.2%) |
| Flat | 5 (4.1%) | 23 (14.8%) | 32 (25.8%) | |
| Concave marginal | 11 (9.1%) | 7 (4.5%) | 0 (0.0%) | |
| Wide covering scapha | 2 (1.7%) | 0 (0.0%) | 0 (0.0%) | |
| Earlobe | Arched | 48 (39.7%) | 51 (32.9%) | 21 (16.9%) |
| Square | 38 (31.4%) | 46 (29.7%) | 50 (40.3%) | |
| Tongue | 31 (25.6%) | 46 (29.7%) | 33 (26.6%) | |
| Triangular | 4 (3.3%) | 12 (7.7%) | 20 (16.1%) | |
| Lobe attachment | Attached | 59 (48.8%) | 65 (41.9%) | 24 (19.4%) |
| Partially attached | 37 (30.6%) | 41 (26.5%) | 54 (43.5%) | |
| Free | 25 (20.7%) | 49 (31.6%) | 46 (37.1%) | |
| Tragus | Knob | 50 (41.3%) | 85 (54.8%) | 49 (39.5%) |
| Long | 40 (33.1%) | 41 (26.5%) | 41 (33.1%) | |
| Round | 31 (25.6%) | 29 (18.7%) | 34 (27.4%) | |
| Darwin's tubercle | Absent | 79 (65.3%) | 112 (72.3%) | 93 (75.0%) |
| Present | 42 (34.7%) | 43 (27.7%) | 31 (25.0%) |
The helix is normally rolled in 85.1, 80.6 and 74.2 percent of these right ears across the three bands, and its flat share climbs the other way, from 4.1 to 25.8 percent. The lobe moves on two of its names: arched falls from 39.7 to 16.9 percent and triangular rises from 3.3 to 16.1. Attachment falls furthest on its leading name, from 48.8 percent to 19.4.
Three of the five separate by age in this group: p < 0.001 for the helix, the lobe and the attachment. The other two do not: p = 0.083 for the tragus, which reads 41.3, 54.8 and 39.5 percent on its knob name, and p = 0.223 for a Darwin's tubercle, present in 34.7, 27.7 and 25.0 percent of them.
Read beside the outline table, the two say the same thing. Age moves the tally, and it moves several of the tallies at once. Which of the six counts a page leads with decides which change you see.
Both count tables and the distance table, one row per reading, with the date each figure was taken. Download ear-shapes-chart.csv
Where these numbers come from, and where they stop
The outline counts, the five more feature counts and the five measurements come from 400 people aged 5 and over, scanned in three dimensions at a clinic in the northern part of India: 400 right ears and 400 left ears, sorted by side, age band and sex.
The second set of outline counts, and the length and width figures beside them, come from 200 adults aged 18 to 30 in central India, measured with a digital calliper.
The projection figures and the child length figure come from 305 primary-school children in Zimbabwe, mean age 11.5 years.
None of the three is a figure for people in general. Each covers one country, one age range and one method, and the three were taken by different teams.
What this chart cannot tell you
None of these numbers is a target. An ear 3 mm away from one of these averages is not a wrong ear, and there is no score on this page.
The four names describe an outline. This page records what was counted and what was measured on the people in the three groups, and nothing else about them.
Each figure here is an average across a group. It says nothing about where one person inside that group sits.
Your two sides are not required to match. The two sides in the 400-person table did not match each other.
The oldest band is open-ended. Over 40 years is a single row, so a 42-year-old and a 70-year-old sit on the same line.
A dash is a gap, not a zero. Where a group did not report a measurement, no figure is given for it.
The eye above the ear, counted the same way, is in Eye Shape Chart. The nose is in Nose Shape Chart. The line the ear sits on is in Jawline Shape, and the four readings that build a face shape from the brow ridge down are in Face Shape Chart.
The 97-second version
If the player does not load, watch it on YouTube: Ear Shapes: Age Groups and Left-Right Comparisons.